This function simplifies the call for one-way ANOVA (ow.anova) on a given data frame. Also allows calls for Tukey's Honestly Significant Difference Post-Hoc Comparisons Test (hsd), as well as a means plot (plot).
Arguments
- df
data frame to read in.
- var1
the dependent/outcome variable, \(Y\).
- by1
the main independent/predictor variable, \(X\). A grouping variable by which
var1should be parsed.- plot
logical (default set to
F). When set toplot = T, will return a means plot with 95 percent confidence intervals, broken out by each group (by1).- hsd
logical (default set to
F). When set tohsd = T, will return results of Tukey's Honestly Significant Difference Post-Hoc Comparisons Test.
Value
This function returns the summary results table for a one-way ANOVA, examining mean differences in var1 from data frame df, across by1 groups.
Examples
data <- mtcars
ow <- ow.anova(data,mpg,cyl,plot=TRUE)
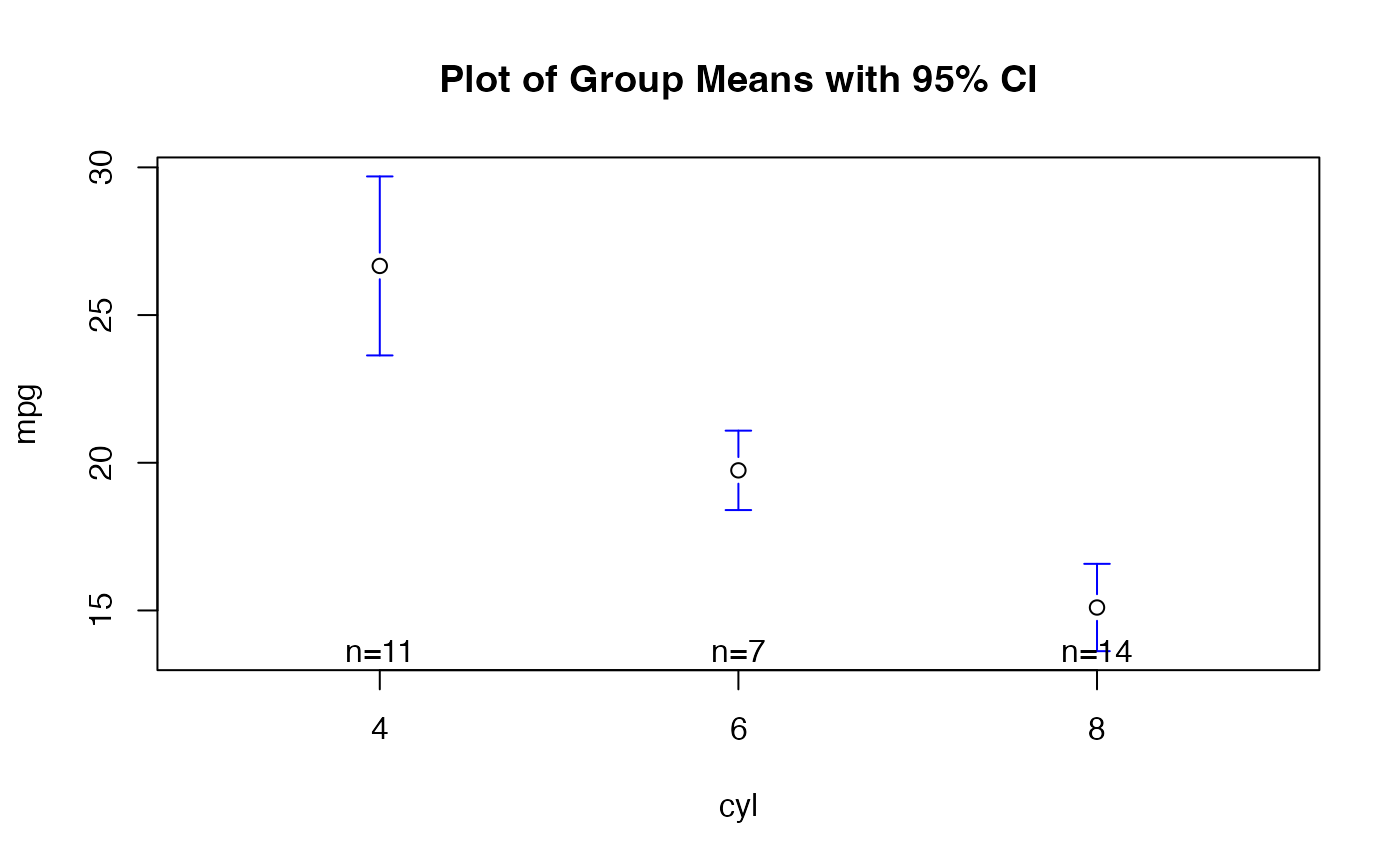 summary(ow)
#> Call:
#> ow.anova(df = data, var1 = mpg, by1 = cyl, plot = TRUE)
#>
#> One-Way Analysis of Variance (ANOVA):
#> df SS MS F p-value
#> Between Groups (cyl) 2.000 824.785 412.392 39.697 4.979e-09 ***
#> Within Groups (cyl) 29.000 301.263 10.388
#> ---
#> Signif. codes: 0 ‘***’ 0.001 ‘**’ 0.01 ‘*’ 0.05 ‘.’ 0.1 ‘ ’ 1
#>
summary(ow)
#> Call:
#> ow.anova(df = data, var1 = mpg, by1 = cyl, plot = TRUE)
#>
#> One-Way Analysis of Variance (ANOVA):
#> df SS MS F p-value
#> Between Groups (cyl) 2.000 824.785 412.392 39.697 4.979e-09 ***
#> Within Groups (cyl) 29.000 301.263 10.388
#> ---
#> Signif. codes: 0 ‘***’ 0.001 ‘**’ 0.01 ‘*’ 0.05 ‘.’ 0.1 ‘ ’ 1
#>