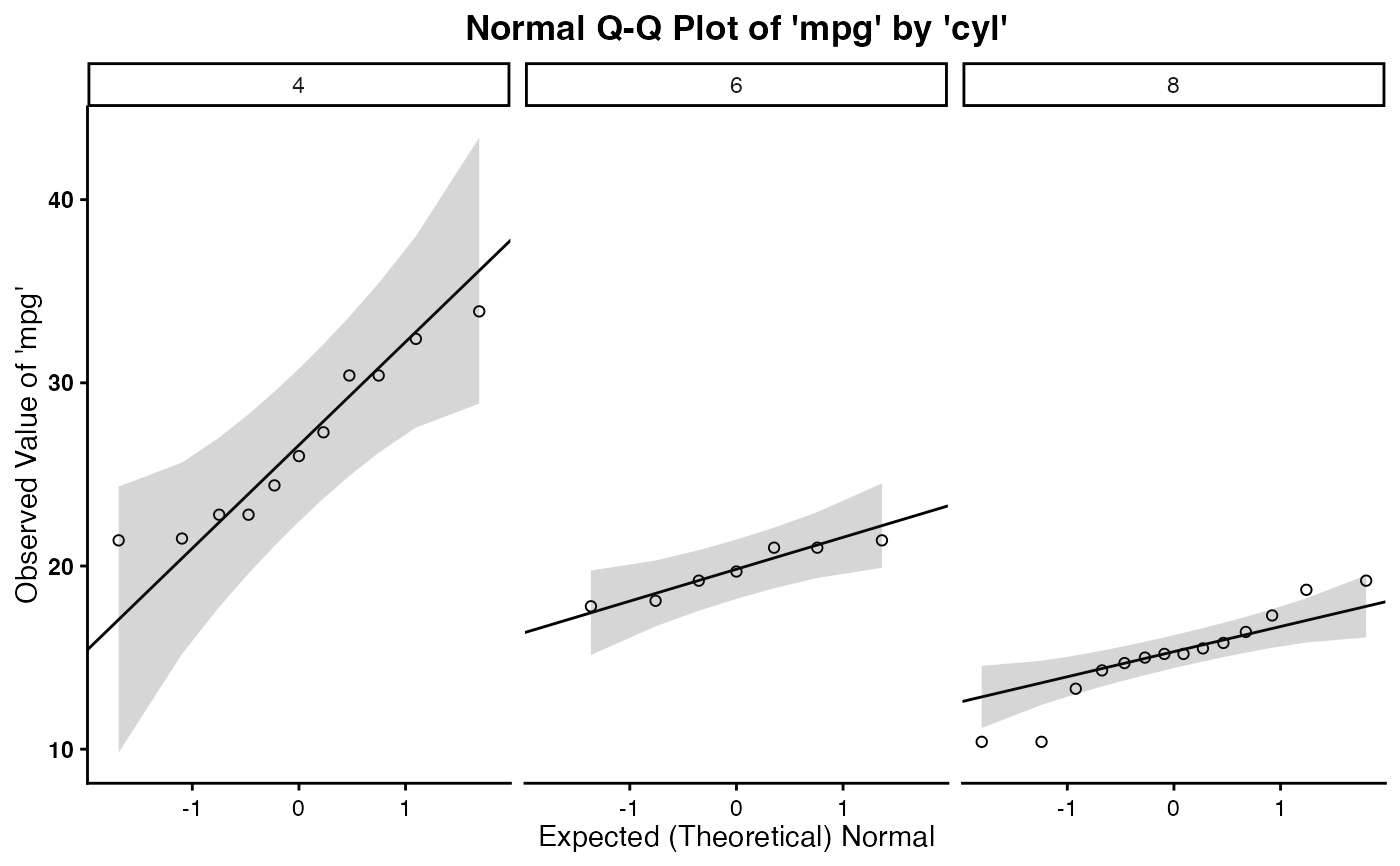
This function plots a Q-Q/Quantile-Quantile plot (qq) on a given data frame, and uses simplified calls within the function to parse the Q-Q plot by up to 2 variables.
Arguments
- df
data frame to read in.
- var1
the dependent/outcome variable, \(Y\). The variable of interest that should be plotted.
- by1
the main independent/predictor variable, \(X_1\). A grouping variable by which the Q-Q plot for
var1should be parsed.- by2
a potential second independent/predictor variable, \(X_2\). A second grouping variable by which the Q-Q plot for
var1(already parsed byby1) should be parsed.