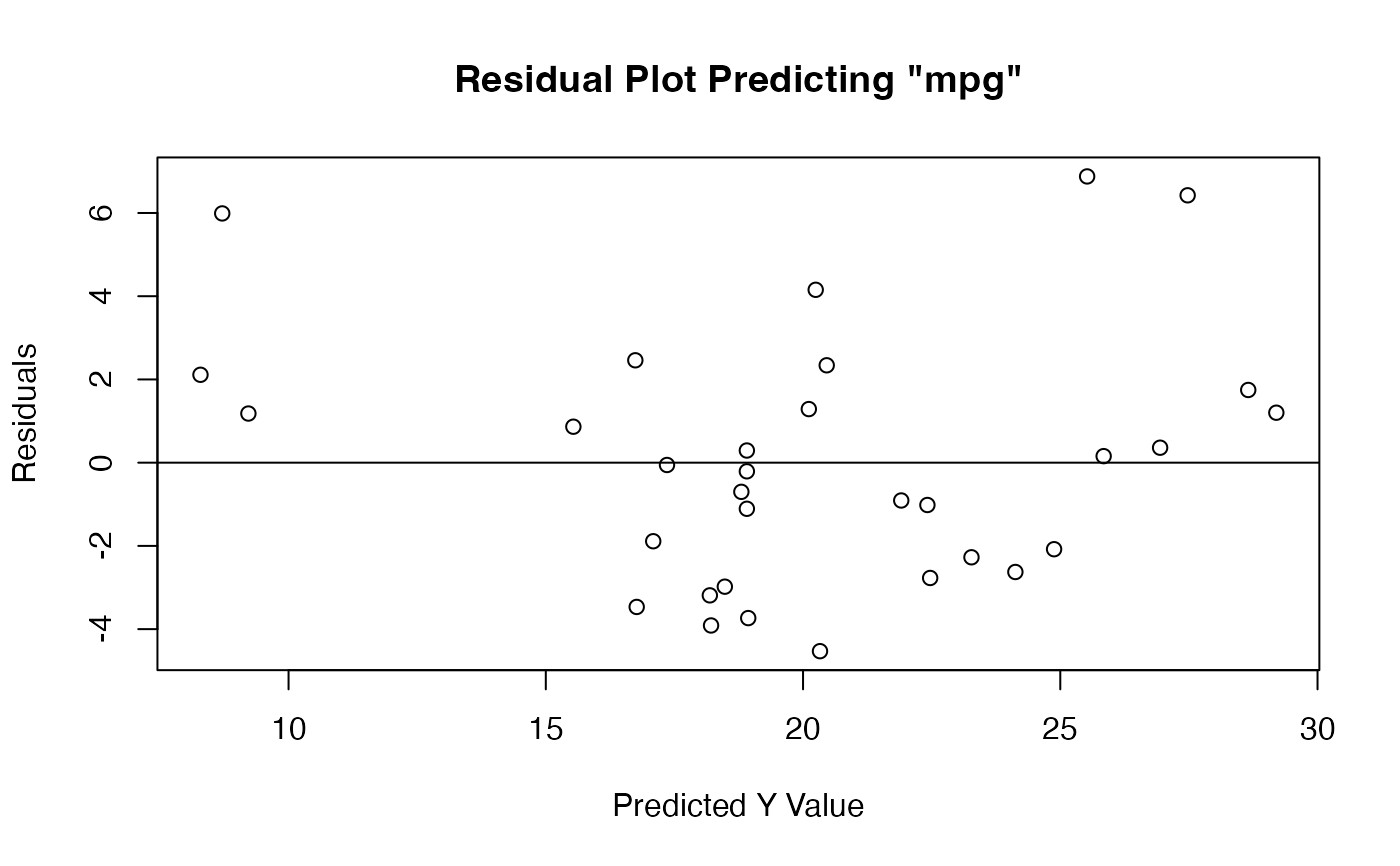
This function creates a residual plot (residplot) on a data frame of the variables in an equation.
Arguments
- df
data frame to read in.
- formula
the variables in the regression model, \(Y = X_1 + X_2 + ... + X_m\), written as Y ~ X1 + X2...
Examples
data <- mtcars

residplot(data, mpg ~ wt + am)