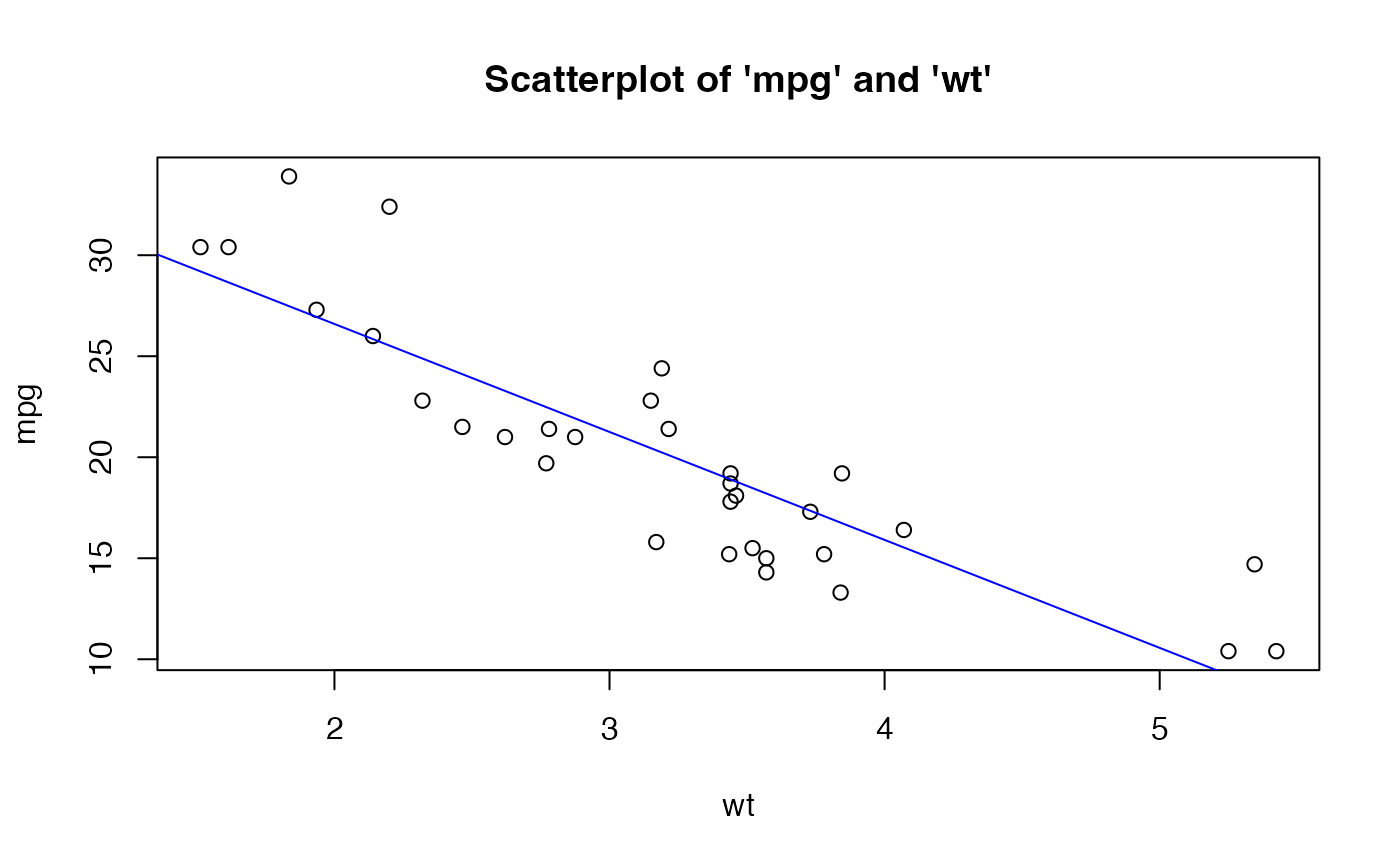
This function plots a scatterplot (scatter) on a given data frame, and adds a fit-line to the data.
Usage
scatter(df, var1, var2, lab = FALSE)
Arguments
- df
data frame to read in.
- var1
the dependent/outcome variable, \(Y\).
- var2
the independent/predictor variable, \(X\).
- lab
logical (default set to FALSE). When set to lab = TRUE, will add Pearson's correlation coefficient (\(r\)) value to the plot.
Examples
data <- mtcars

scatter(data,mpg,wt)